Real-time Monitoring
LiveNX provides the capability to display real-time trunk and access port statistics for a given VLAN on a device.
Use the VLAN drop-down to list the trunk and access ports associated with the VLAN. Selecting an individual VLAN in the System Hierarchy or clicking on the VLAN in the topology view automatically selects the VLAN in the drop-down. The default selection is All.
The alert indicator in the first column of each row describes the trunk and access port health; the alert colors are the same as the topology view legend.
Click on the desired device in the LAN tab to display the statistics.
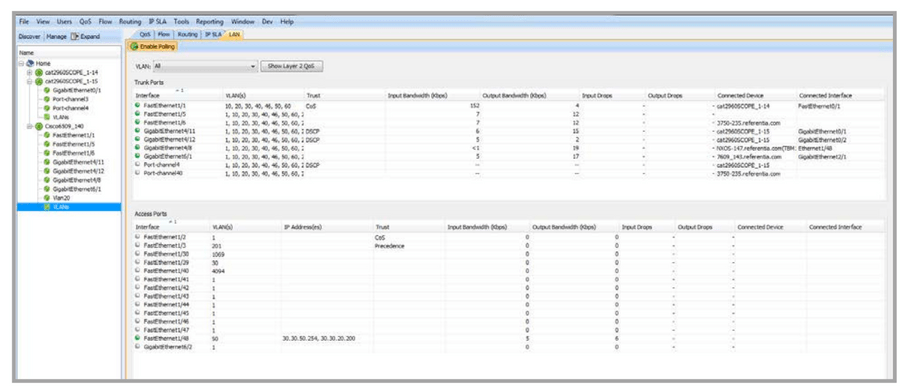
The statistics are separated into Trunk Ports and Access Ports. Both tables display Interface, Trust, Input Bandwidth (Kbps), Output Bandwidth (Kbps), Interface Drop, Connected Device and Connected Interface.
• Interface Name: Interface associated with the desired device.
• Trust: Class of Service (CoS), Differentiated Services Code Point (DSCP), IP Precedence (Precedence) or none (untrusted).
• Input Bandwidth: Input bandwidth for that interface. • Output Bandwidth: Output bandwidth for that interface.
• Interface Drop: Alert indicator with Green for Normal, Yellow for Drops, Red for Warning, Gray for Down and Blue for All Polling Disabled.
• Connected Device: Device connected to the Interface. • Connected Interface: Interface name of the connected device.
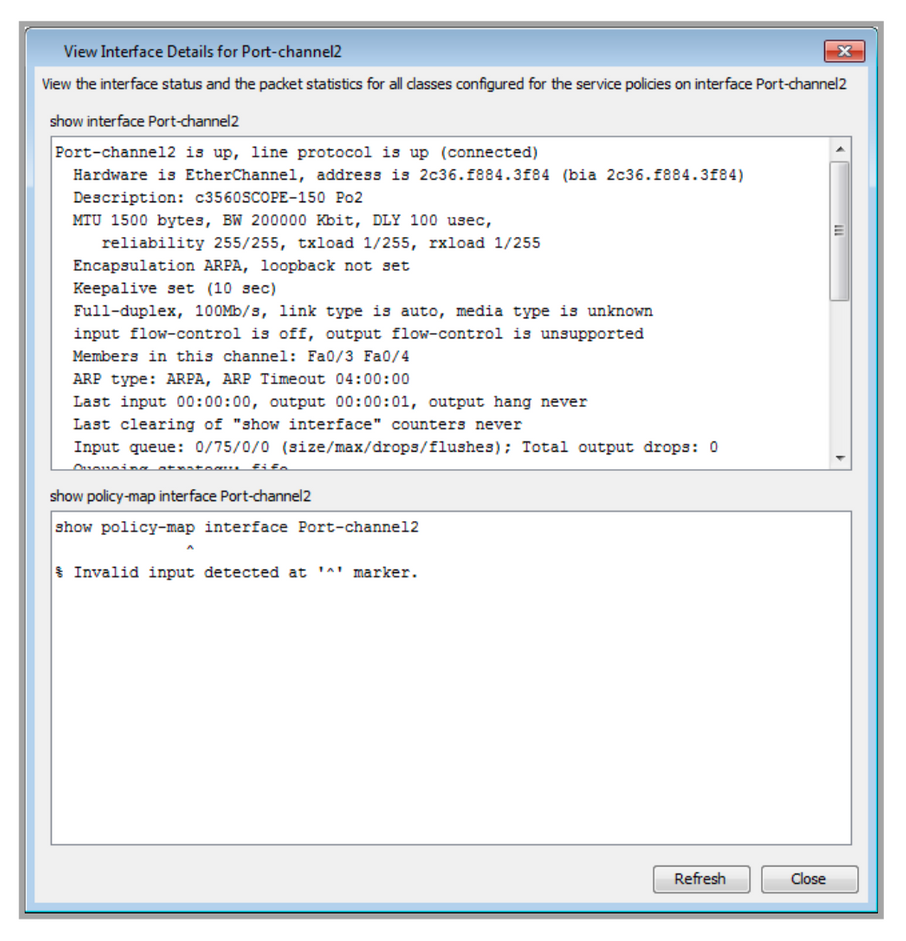
Right-clicking on the text in a table entry provides two options: Show Interface Details and Export Data.
• Show Interface Details – LiveNX displays two boxes: show interface and show policy-map.
• Show interface port provides packet statistics at the last polling interval. The Refresh button will update the stats based on the most current polling interval.
• Show policy-map provides packet statistics for all classes for the service policies defined at the last polling interval. The Refresh button will update the stats based on the most current polling interval. Export Data brings up a dialog box to allow you to save the contents of the Layer 2 statistics table into a CSV (comma separated value) formatted text file.
Click on the Show Layer 2 QoS button to display Layer 2 QoS statistics in tabular form.
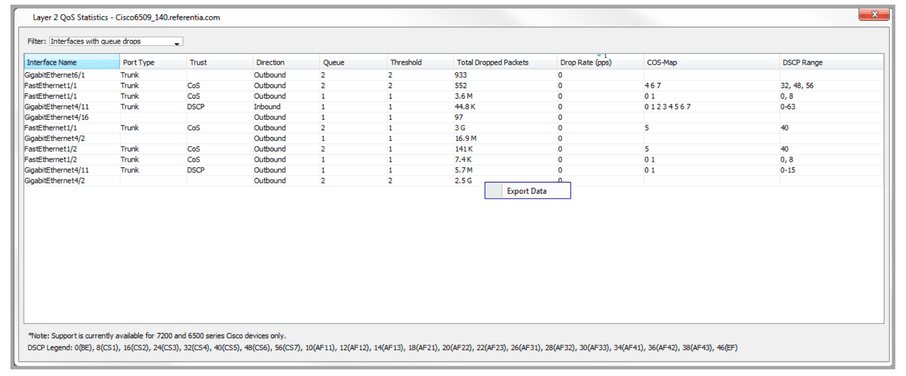
The Layer 2 QoS Statistics table lists all interfaces and its QoS statistics. The table can be filtered using four fields. Each can be enabled on or off independently from the other. The default filter is Interface with queue drops = Enabled.
• Interface with queue drops – Displays all interfaces where the Total Dropped field is > 0.
• Priority queue stats – Displays all interfaces with COS-Map = 5.
• Inbound queues – Displays all interfaces with the Direction = Inbound.
• Outbound queues – Displays all interfaces with the Direction = Outbound.
Export Data brings up a dialog box allowing you to save the contents of Layer 2 QoS Statistics into a .csv (comma separated value) format.